
This article demonstrates how Tycho can be used to gain valuable data on how a process or malware sample behaves to therefore detect said sample successfully. With the help of the ELK (Elasticsearch, Logstash, Kibana) stack it is possible to display the gained data in a dashboard to visualize how the sample behaves.
What’s the value for malware analysts?
Making use of Tychoour malware forensics suit, and its great applicability, a malware analyst is able to effectively monitor any process by evaluating system calls. This means by looking at these system calls it is possible to extract data, filter for behavior which is known to be exclusive to a malware sample and portray occurrence of this behavior in an orderly fashion. For this, Tycho is used to extract all necessary data from a process that is running on a target PC. The data is extracted from system calls and dumped into log files which are read by Logstash to be added to the Kibana dashboard. SIGMA rules can then be set up to filter for certain behavior, and are integrated into visualizations in the dashboard. The dashboard is part of the ELK stack and can also be fed data that is extracted live by Tycho. This means that once the visualization is done, the dashboard can effectively identify any process that is thought to be any malicious sample which was dealt with earlier.
Gandcrab
To showcase the power of this Tycho-based dashboard I have analyzed a well known and recent malware sample. This ransomware is called Gandcrab V5.0 and has earned its blackmailers approximately 2 billion US $ until it was shut down in May 2019.
Hardware setup
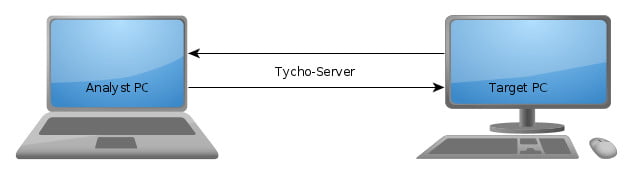
As shown in the figure below, the hardware setup is a standard Tycho setup. This consists of an analyst PC and a target PC. While monitoring a process with this setup, it is possible to both collect data live and at a later point in time.
For more information on how to set this up exactly and what Tycho actually is, please see this blog article.
Software interaction
This dashboard, an example is shown below, is based on Tycho. It also uses SIGMA rules and the ELK stackwhich consists of a Elasticsearch database, Logstash and Kibana (the actual dashboard).

The image below illustrates this interaction. Tychoand the syscall_process_tracing.py script form the heart piece. The script, which is explained in detail in the abstract below, extracts all the data from the target PC and converts it into suitable log files. These log files are further processed by Logstash to be added to the EN database where the data is then read by the Kibana dashboard. The data can be viewed in the dashboard as raw database entries and via visualizations, of which the latter can also be filtered using SIGMA rules.

The syscall_process_tracing.py script
This specifically created script interprets system calls on the target PC to gather data. It is quite special in the way that it handles specific system calls to grant the ability to track child processes. This is important because malware often tries to disguise itself by spawning multiple processes, for example to load malicious code at a later point in time. Gandcrab on the other hand quickly terminates the initial process called sobcast.exe after spawning a child process, which is called called wermgr.exe. This can be seen by watching the terminal output of syscall_process_tracing.py in the image below. wermgr.exe is responsible for writing ransom notes and most importantly encrypting files. Without the ability to track child processes, an effective way to track this malware would not be possible.
The following two code snippets show how child process tracking is implemented. Whenever the handle_syscall_event() function realizes the system call NtCreateUserProcess is called, the PID of the child process is determined:
def handle_syscall_event(
    fact, process, event, process_name, level, childprocess_id_list
):
    with fact.syscall_interpretation(
        ev, pointer_tracking=pointer_tracking, custom_handlers=custom_handlers
    ) as interpreter:
        name = interpreter.get_syscall_name()
        in_parameters = interpreter.get_parameters()
        if name == "NtCreateUserProcess":
            child_pid = get_child_pid(process.get_pid(), childprocess_id_list)
            if child_pid is not None:
                child_process = pyTycho_service.open_process_by_pid(child_pid)
                child_process.pause()
                sub = subprocess.Popen(
                    [
                        PYTHON_BIN,
                        sys.argv[0],
                        "--pid",
                        str(child_pid),
                        "-l",
                        str(level + 1),
                    ]
                )

            else:
                print(
                    "No matching Child PID was found in the process-list."
                    " Therefore, no subscript was started."
                )
A process can spawn multiple child processes. For this reason, we need to keep track of child processes that have been spawned earlier to ensure the subscript is created with the correct PID. It could also be possible for a process to terminate extremely quickly, in which case a tracking might fail. In this unlikely case, None would be returned as can be seen above. Whenever a child_pid is found it is immediately stopped and a subscript of syscall_process_tracing.py is started to track the new child process. The subscript will attach itself to the child process’s PID and continue the process. It is necessary to stop the process at first and let the subscript continue as only the subscript is able to log the child process’s data.
def get_child_pid(parent_pid, childprocess_id_list):
    pl = pyTycho_service.get_process_list()
    for test_child in pl:
        if (
            test_child.parent_pid == parent_pid
            and test_child.pid not in childprocess_id_list
        ):
            childprocess_id_list.append(test_child.pid)
            return test_child.pid
    return None
Depending on the sample, an analyst should know which system calls are important to watch and which are not. The system call whitelist has to be set accordingly. In this case, interesting system calls would be NtCreateUserProcess, NtCreateKey and NtWriteFile for example. These are used to spawn a new process, create, alter or access a registry key or to create or access a file respectively.
Also, depending on the system call, input and output parameters of system calls can be of different encoding. This is a problem because the script dumps the system calls’ data into a .json log file which can crash if data is not ASCII encoded. To ensure all data is encoded correctly, a universal decoder is used. It determines the encoding and decides to either drop data or encode it into ASCII. Data can be dropped if no encoding could be found or when the encoding already shows that this data is irrelevant. An example for this would be content data encoded in Windows-1252 which used by the system call NtWriteFile as control data instead of data that is actually written to a file like for example a string.
SIGMA rules
SIGMA rules offer the ability to filter the massive amount of data for the most relevant parts. The rules are handwritten in a .yml filewhich then have to be compiled into a .json file using the special sigmac.py script that has been created by the makers of SIGMA. The compiled rules are imported into the dashboard to filter the data.
Integration into the dashboard
The Kibana dashboard imports all data logs automatically with the help of Logstash. The logs therefore have to be placed within a specific folder, which in turn means that it is possible to both monitor a system live and offline by importing logs from let’s say a different analyst PC. It is worth mentioning that Logstash seems to have issues with large (>30MB) log files, so splitting the logs could prove helpful for some users. SIGMA rules can be imported in Kibana and added to a visualization in order to make the visualization show only the filtered data. As with Gandcrab V5.0 I have found out that Gandcrab, for example, creates a specific registry entry to save the private and public keys. This happens in REGISTRY\MACHINE\SOFTWARE\Wow6432Node\keys_data\data which in turn means that if a process tries to create an entry in this exact folder, it is most certainly Gandcrab V5.0. As a result, I have written an SIGMA rule to track this occurrence. The rule can be seen in the .yml file below and is integrated into a visualization, as seen in the picture following the file.
title: This SIGMA rule is supposed to trigger if the system call NtCreateKey is used to successfully create the registry key "*keys_data\data"
author: Philipp Barthel
status: experimental
logsource:
    product: windows
detection:
    selection:
        name: 'NtCreateKey'
        before.ObjectAttributes.tracked.value.ObjectName.tracked.value.content: "\\REGISTRY\\MACHINE\\SOFTWARE\\Wow6432Node\\keys_data\\data"
        return_value: 0
    condition:
        selection
falsepositives:
    - any process could theoretically raise this system call and create the specified key
Summary
Using Tycho’s ability to interpret system calls of any process, I was able to gather valuable data on how Gandcrab V5.0 works beforehand. I used this information to create filter rules (SIGMA) to characterize the ransomware and as a result I have gained the ability to determine if a monitored process actually is Gandcrab.
Obviously, it would be possible to repeat this whole process for any malicious sample. But one rule alone is always prone to false positives. An analyst should extend his set of filter rules for any sample to diminish the possibility of false positives.
An analyst could amass SIGMA rules for all sorts of malware samples to be able to efficiently recognize these malicious programs at a later point in time. Therefore, an analyst is enabled to determine if a process behaves like any malware sample that was dealt with earlier by creating a toolbox of SIGMA rules to detect behavior that is known to be suspicious.
Source: https://www.cyberus-technology.de/posts/2020-02-04-dashboard.html